How to Save or Export Excel Chart as PDF

This post will guide you on how to save or export Excel charts as PDF using the move chart feature and VBA code. And we will provide you with the necessary steps to export multiple charts into a PDF file.

The move chart feature allows you to easily move charts to a new worksheet, which is useful when exporting multiple charts. Additionally, we will provide VBA code that automates the process of exporting multiple charts into a single PDF file.

Save one Chart to a PDF Page

You can save an Excel chart as a PDF page by following these steps:

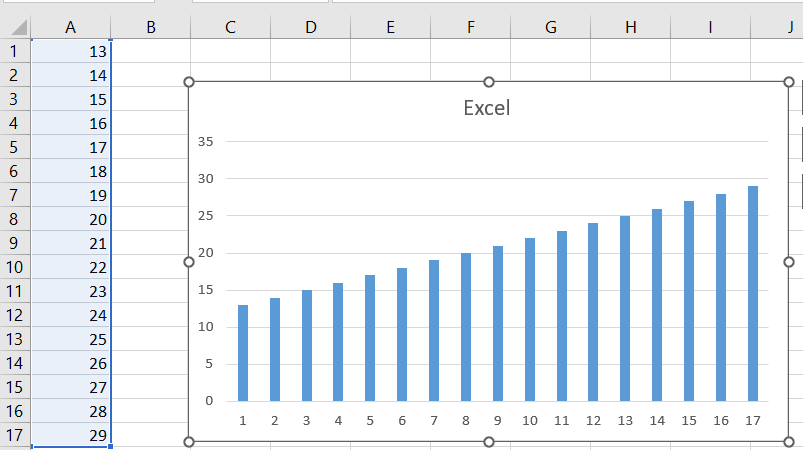
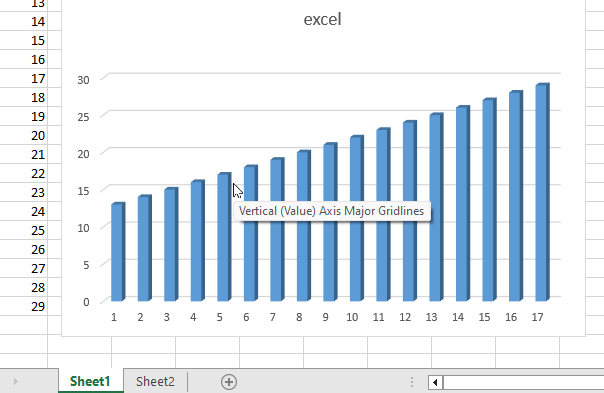
Step1: Select the chart you want to save as a PDF.

How to Save or Export Excel Chart as PDF 1.png

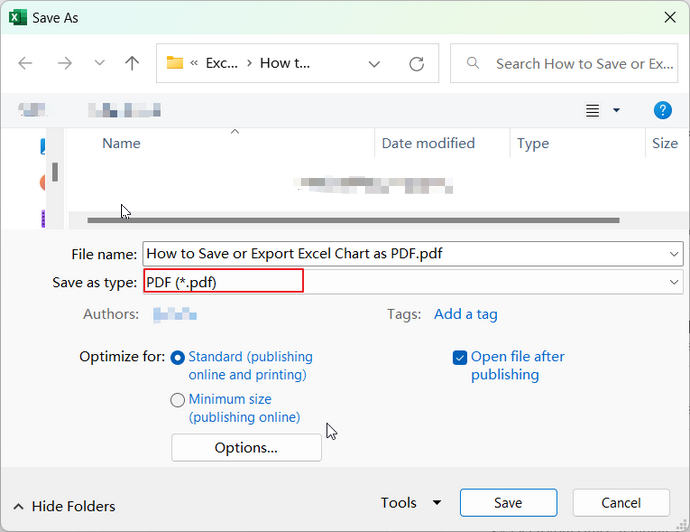
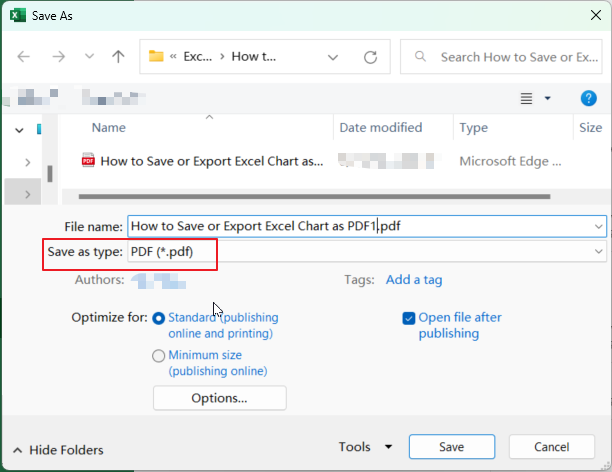
Step2: Click on the “File” menu in Excel, then select “Save As“. the “Save As” dialog box will open. Choose the location where you want to save the PDF file. In the “Save as type” dropdown menu, select “PDF (*.pdf)”. Enter a name for the PDF file in the “File name” field.

How to Save or Export Excel Chart as PDF 21.png

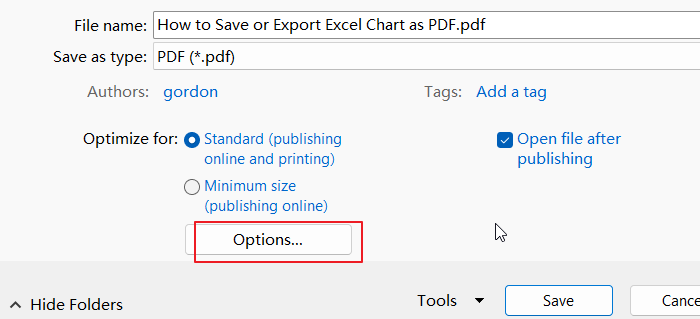
Step3: Click on the “Options” button to open the “Options” dialog box.

How to Save or Export Excel Chart as PDF 3.png

Step4:  In the “Options” dialog box, choose the “Selected chart” option under the ” Publish What” section.

How to Save or Export Excel Chart as PDF 4.png

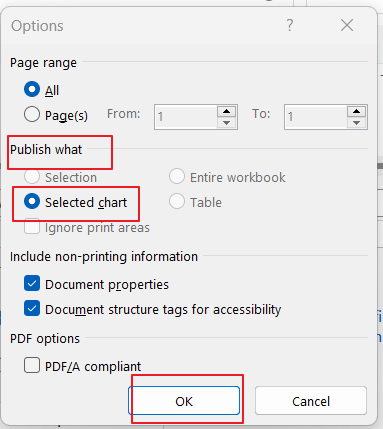
Step5: Click on the “OK” button to close the “Options” dialog box.

Step6: Click on the “Save” button to save the chart as a PDF file.

How to Save or Export Excel Chart as PDF 5.png

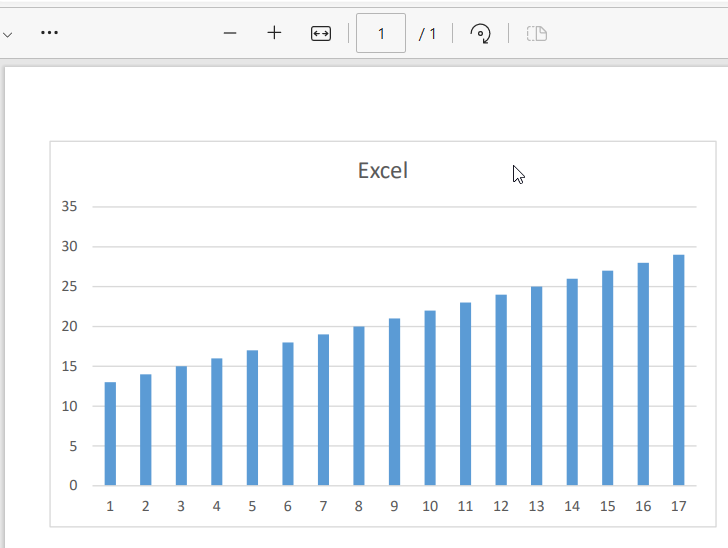
The resulting PDF file will contain only the selected chart and nothing else.

Export Multiple Charts into one PDF File using Move Chart

If you need to print several charts, it can be more efficient to print them all at once in one document rather than printing them separately.

Here are the steps to export multiple charts into one PDF file:

Step1: Select the first chart you want to export.

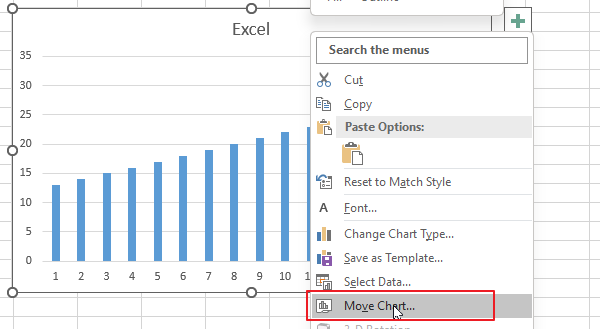
Step2: Right-click on one of the selected charts and choose “Move Chart“. The “Move Chart” dialog box will open.

export multiple excel charts as pdf 1.png

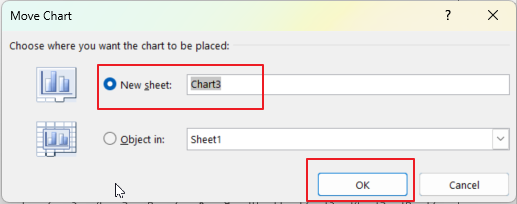
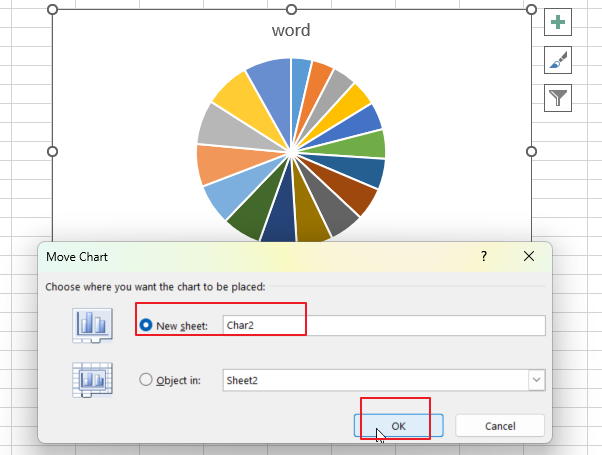
Step3: In the “Move Chart” dialog box, select the “New sheet” radio button and click “OK“.

export multiple excel charts as pdf 2.png

Step4: Repeat steps 1-3 for each chart you want to export.

export multiple excel charts as pdf 3.png

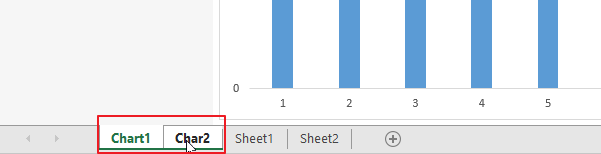
Step5: Select all of the charts by holding down the Ctrl key and clicking on each chart sheet tab that you want to export.

export multiple excel charts as pdf 4.png

Step6: Click on the “File” menu and choose “Save As“. Choose “PDF” as the file type in the “Save As” dialog box. Enter a name for the PDF file.

export multiple excel charts as pdf 5.png

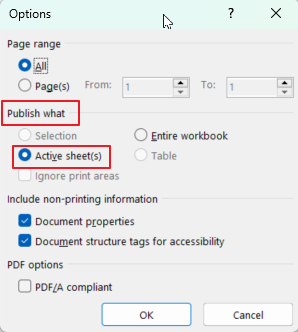
Step7: In the “Save As” dialog box, choose the option “Active sheet” under “Publish what“. Click on the “OK” button to close the dialog box.

export multiple excel charts as pdf 6.png

Step8: Click on the “Save” button to save the PDF file.

export multiple excel charts as pdf 7.png

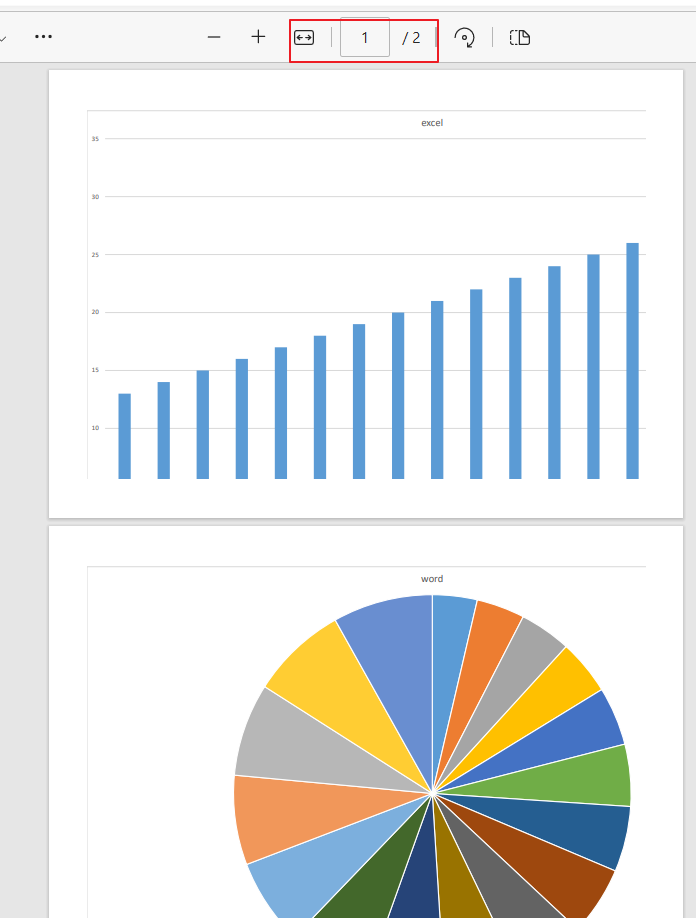
You can see that the last PDF file will contain one page for each chart you exported, with each chart on a separate page.

Export Multiple Charts into one PDF File with VBA Code

You can save or export multiple charts in the active workbook into one PDF file using VBA Code in Excel, and each chart is in a separate page. Just do the following steps:

Step1: Open your Excel workbook that contains the charts you want to export.

export multiple excel charts as pdf vba 1.png

Step2: Press “Alt + F11” to open the Microsoft VBA Editor.

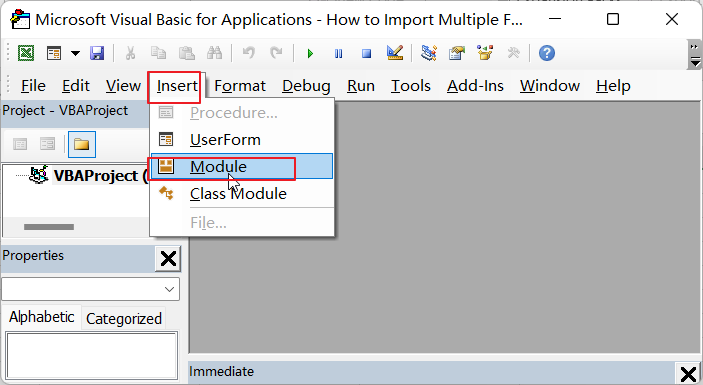
Step3: In the VBA Editor, click “Insert” from the top menu, then choose “Module“.

Step4: In the new module, paste the below VBA code.

export multiple excel charts as pdf vba 2.png
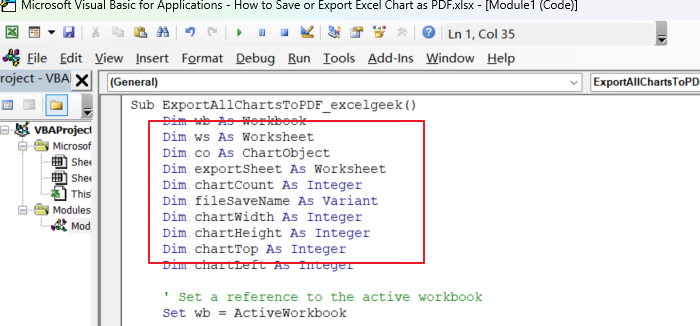
Sub ExportAllChartsToPDF_excelgeek()
    Dim wb As Workbook
    Dim ws As Worksheet
    Dim co As ChartObject
    Dim exportSheet As Worksheet
    Dim chartCount As Integer
    Dim fileSaveName As Variant
    Dim chartWidth As Integer
    Dim chartHeight As Integer
    Dim chartTop As Integer
    Dim chartLeft As Integer
    
    ' Set a reference to the active workbook
    Set wb = ActiveWorkbook
    
    ' Create a new worksheet to export the charts
    Set exportSheet = wb.Worksheets.Add
 
    'Copy each chart to the export sheet
    For Each mySheet In wb.Worksheets
        For Each myChart In mySheet.ChartObjects
            chartCount = chartCount + 1
            If chartCount > 0 Then
                exportSheet.HPageBreaks.Add Before:=exportSheet.Cells(chartCount * 30, 1)
                'exportSheet.Cells(chartCount * 30, 1).Select
            End If
            myChart.Chart.ChartArea.Copy
            exportSheet.Paste Destination:=exportSheet.Cells(chartCount * 30 - 29, 1)
            
        Next myChart
    Next mySheet
    
    ' Check if any charts were exported
    If chartCount = 0 Then
        MsgBox "No charts found in workbook."
        exportSheet.Delete
        Exit Sub
    End If


    ' Export the export sheet as a PDF file
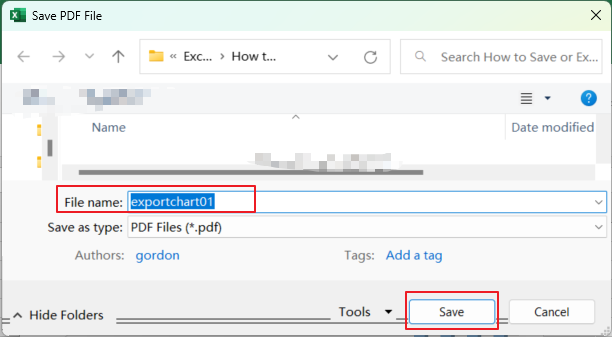
    fileSaveName = Application.GetSaveAsFilename(fileFilter:="PDF Files (*.pdf), *.pdf", Title:="Save PDF File")
    If fileSaveName <> False Then
        'exportSheet.ExportAsFixedFormat Type:=xlTypePDF, fileName:=fileSaveName
        exportSheet.ExportAsFixedFormat Type:=xlTypePDF, fileName:=fileSaveName, Quality:=xlQualityStandard, IncludeDocProperties:=True, IgnorePrintAreas:=False, OpenAfterPublish:=False

    End If
    
    ' Delete the export sheet
    Application.DisplayAlerts = False
    exportSheet.Delete
    Application.DisplayAlerts = True
End Sub

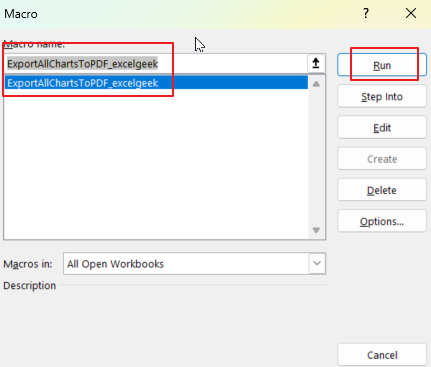
Step5: Run the code by clicking the “Run” button or pressing “F5“. Or Press ALT + F8 to open the Macro dialog box or click on Macros command under Code group. Then select the macro named “ExportSelectedChartAsPicture_excelgeek” from the list of macros and click on “Run”.

export multiple excel charts as pdf vba 3.png

Step6: choose one location where you want to save the PDF file.

export multiple excel charts as pdf vba 4.png

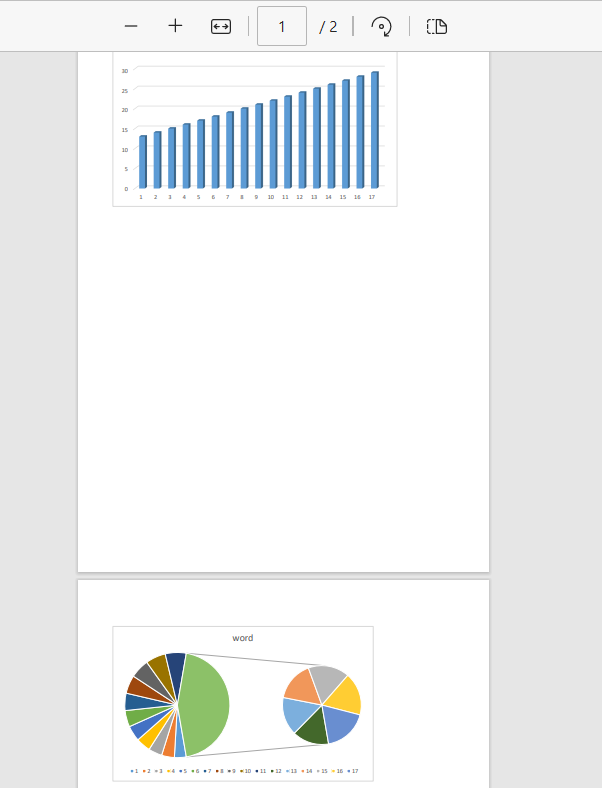
Step7: The code will export all the charts in your workbook into one PDF file and save it to your specified location.

export multiple excel charts as pdf vba 5.png

Conclusion

Exporting charts as PDFs is useful when you need to share or print them. If you have multiple charts in your Excel document and want to export them as a single PDF file with each chart on a separate page, you can use the VBA code provided in this article.

How to Export Single or Multiple Charts from Excel Worksheet to PowerPoint

This post will provide you with step-by-step instructions on how to export one or more charts from Excel to PowerPoint using VBA code.

This VBA code provides a simple and efficient way to export one or more charts from an Excel worksheet to PowerPoint. Before running VBA code,  you need make sure that the Microsoft PowerPoint is installed on your computer, and that the PowerPoint object library is selected in the Visual Basic Editor.

How to Enable PowerPoint Object Library?

To select the PowerPoint object library in Visual Basic Editor, just follow these steps:

Step1: Open the Visual Basic Editor by pressing “Alt + F11” on your keyboard.

Step2: Go to “Tools” > “References” in the menu bar. the References-VBAProject window will open.

How to Export Single or Multiple Charts from Excel Worksheet to PowerPoint 1.png

Step3: Scroll down the list of available references in References-VBAProject window and look for “Microsoft PowerPoint <version> Object Library“, where “<version>” is the version of PowerPoint installed on your computer. Check the box next to the PowerPoint object library to select it. Click “OK” to save the changes and close the References dialog box.

How to Export Single or Multiple Charts from Excel Worksheet to PowerPoint 2.png

After selecting the PowerPoint object library, you can use VBA code to interact with PowerPoint in your Excel workbook. For example, you can create a new instance of PowerPoint, open a presentation, add new slides, insert text and shapes, and so on.

Export Single or Multiple Charts from Excel Worksheet to PowerPoint with VBA Code

You can refer to the following steps to export single or multiple charts from your worksheet to a PowerPoint file with VBA code:

Step1: Open your Excel workbook and navigate to the worksheet that contains the chart(s) you want to export.

How to Export Single or Multiple Charts from Excel Worksheet to PowerPoint 3.png

Step2: Open the Visual Basic Editor by pressing “Alt + F11” on your keyboard.

Step3: In the Visual Basic Editor, go to “Insert” > “Module” to create a new module.

Step4: In the new module, paste the following VBA code, Save the VBA module and return to the Excel worksheet.

How to Export Single or Multiple Charts from Excel Worksheet to PowerPoint 4.png
Sub ExportChartsToPowerPoint_excelgeek()
    
    ' Declare variables
    Dim pptApp As PowerPoint.Application
    Dim pptPres As PowerPoint.Presentation
    Dim pptSlide As PowerPoint.Slide
    Dim pptShape As PowerPoint.Shape
    Dim chartObj As ChartObject
    Dim chartRange As Range
    Dim slideIndex As Integer
    
    ' Prompt user for PowerPoint file name and location
    pptFileName = Application.GetSaveAsFilename(FileFilter:="PowerPoint Presentation (*.pptx), *.pptx", Title:="Save as PowerPoint Presentation")
    
    ' Exit if user cancels or no file is selected
    If pptFileName = False Then Exit Sub
    
    ' Create new PowerPoint application and presentation
    Set pptApp = New PowerPoint.Application
    Set pptPres = pptApp.Presentations.Add
    
 ' Loop through each chart object in the active worksheet
For Each chartObj In ActiveSheet.ChartObjects
    
    ' Create a new slide in the PowerPoint presentation
    Set pptSlide = pptPres.Slides.Add(pptPres.Slides.Count + 1, ppLayoutTitleOnly)
    slideIndex = pptSlide.slideIndex
    
    ' Copy the chart to the clipboard and paste it as an image onto the slide
    chartObj.Chart.ChartArea.Copy
    pptSlide.Shapes.Paste
    Set pptShape = pptSlide.Shapes(1)
    
    ' Format the chart image as desired
    pptShape.Width = 400
    pptShape.Height = 300
    pptShape.Left = 100
    pptShape.Top = 100
    
    ' Add a title to the slide
    pptSlide.Shapes.Title.TextFrame.TextRange.Text = chartObj.Chart.ChartTitle.Text
    
Next chartObj
    
    ' Save and close the PowerPoint presentation
    pptPres.SaveAs pptFileName
    pptPres.Close
    
    ' Clean up
    Set pptApp = Nothing
    Set pptPres = Nothing
    Set pptSlide = Nothing
    Set pptShape = Nothing
    Set chartObj = Nothing
    Set chartRange = Nothing
    
    ' Show message box to confirm export
    MsgBox "Charts exported to " & pptFileName
    
End Sub

Step5: Run the VBA code by going to “Developer” > “Macros” and selecting the “ExportChartsToPowerPoint_excelgeek” macro.

How to Export Single or Multiple Charts from Excel Worksheet to PowerPoint 5.png

Step6: This code will prompt the user for a file name and location to save the PowerPoint presentation.

How to Export Single or Multiple Charts from Excel Worksheet to PowerPoint 6.png

Step6: The code will create a new instance of PowerPoint, open a new presentation, and loop through each chart on the active worksheet.

How to Export Single or Multiple Charts from Excel Worksheet to PowerPoint 7.png

For each chart, the code will copy the chart and paste it as an Enhanced Metafile on a new slide in the PowerPoint presentation.

If the slide contains four or more charts, the code will add a new slide to the presentation before pasting the next chart.

Step7: When the code finishes running, a message box will appear indicating that the charts were exported successfully.

How to Export Single or Multiple Charts from Excel Worksheet to PowerPoint 7.png

Conclusion

Exporting charts to PowerPoint can be a time-consuming process, especially when dealing with multiple charts. With the VBA code, you can automate this process and save yourself valuable time.