This post will explain the process of creating a Data Model in Excel. We will cover the steps involved in creating a Data Model, from importing data to creating relationships between tables. By the end of this post, you will have a solid understanding of how to use the Data Model in Excel and harness its full potential.
What is Data Model?
A data model in Excel is a representation of data that provides a structure for organizing and analyzing large amounts of data. It allows you to import data from multiple tables and create relationships between the tables, so that you can easily combine and analyze the data in new ways.
The Data Model in Excel is stored in a compact and efficient format that is optimized for fast data analysis, and it supports powerful features such as pivot tables, pivot charts, and DAX formulas. By using the Data Model in Excel, you can simplify the process of working with large data sets, and perform complex data analysis tasks with ease.
Create Data Model in Excel
If you want to create a data model in Excel, you can follow these steps:
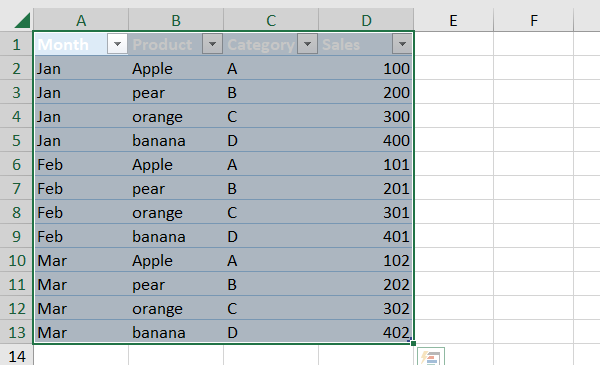
Step 1: You need to Convert your data into tables with unique headers and select this table.
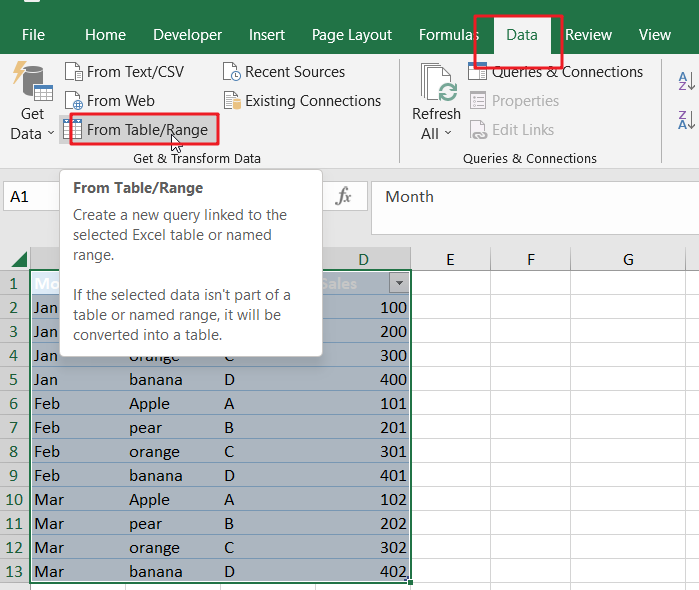
Step 2: then you need to go to the “Data” tab and click “From Table/Range“.
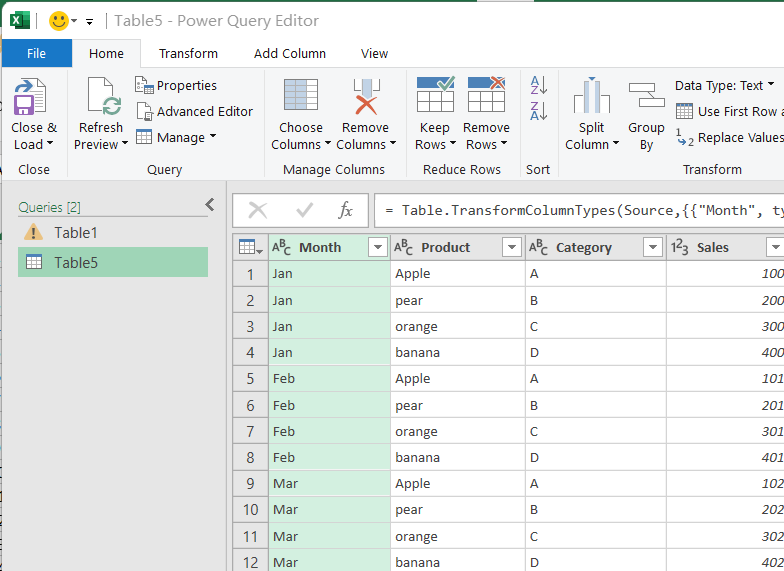
Step 3: Select the current table you want to include in the data model in the Power Query Editor window and click “Close &Load“.
Step 4: Repeat the process for any additional tables you want to include in the data model.
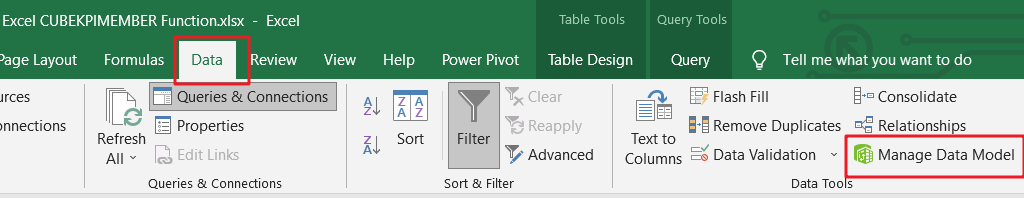
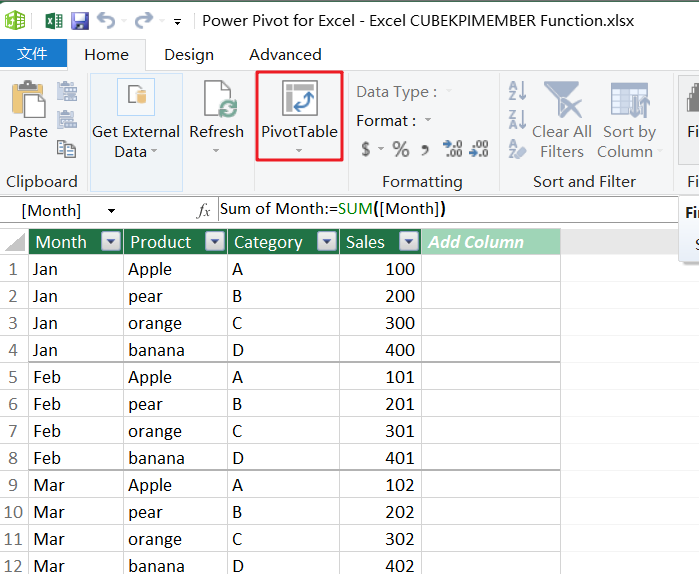
Step 5: then click the “Manage Data Model” button in the “Data Tools” group.
Step 5: You can now use the data model to create pivot tables, pivot charts, and other data visualizations that summarize and analyze your data.
Data Model Examples in Microsoft Excel Spreadsheet
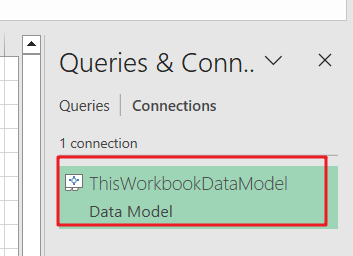
The above steps have been created one data model named as “ThisWorkbookDataModel”. This Section will show you how to add a key performance indicator (KPI) to your data model(ThisWorkbookDataModel) in Excel.
Step 1: You can click the “Manage Data Model” button in the “Data Tools” group.
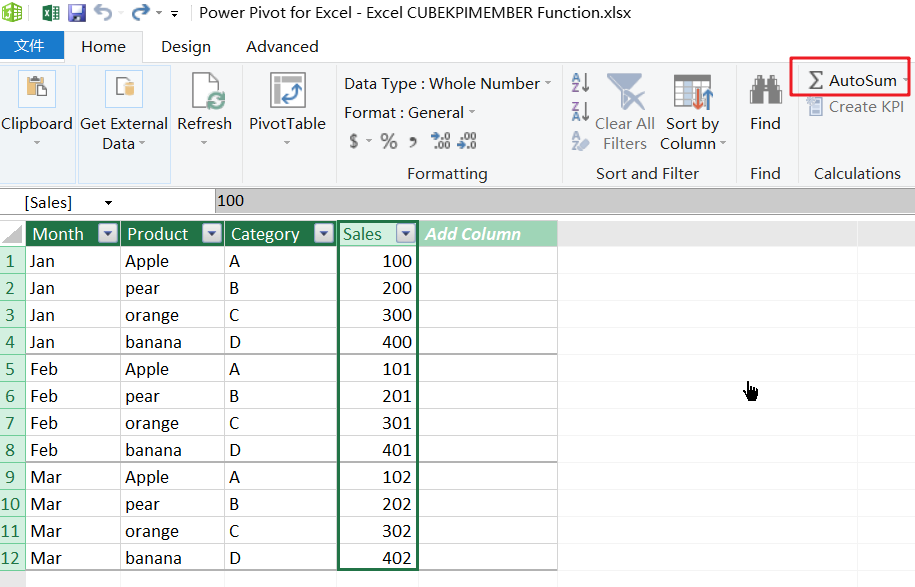
Step 2: select Sales column, and then click on AutoSum button, and the Sum of Sales measure would be created.
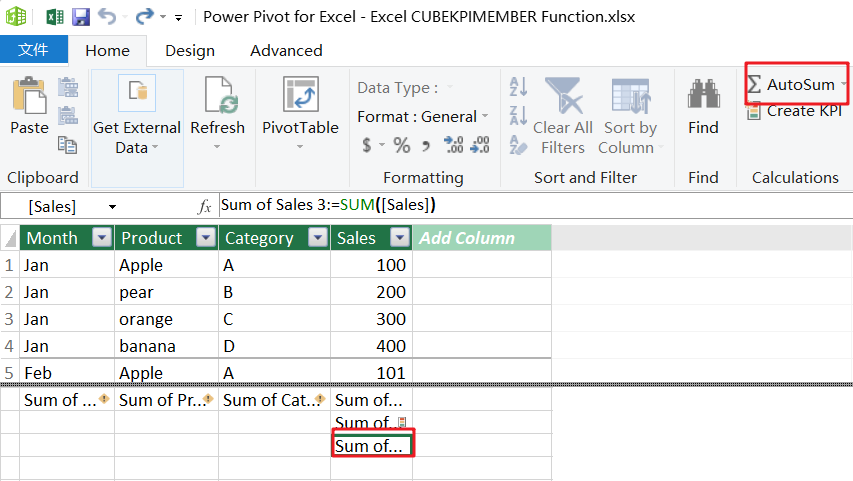
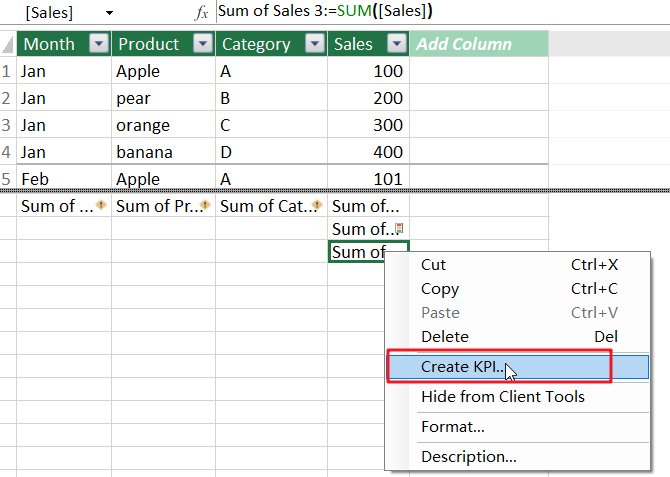
Step 3: right click on the Sum of Sales measure and then select Create KPI.
Step 4: The Key Performance Indicator dialog box will open. And choose the Sum of Sales Measure from the drop down list, and click on Ok button.
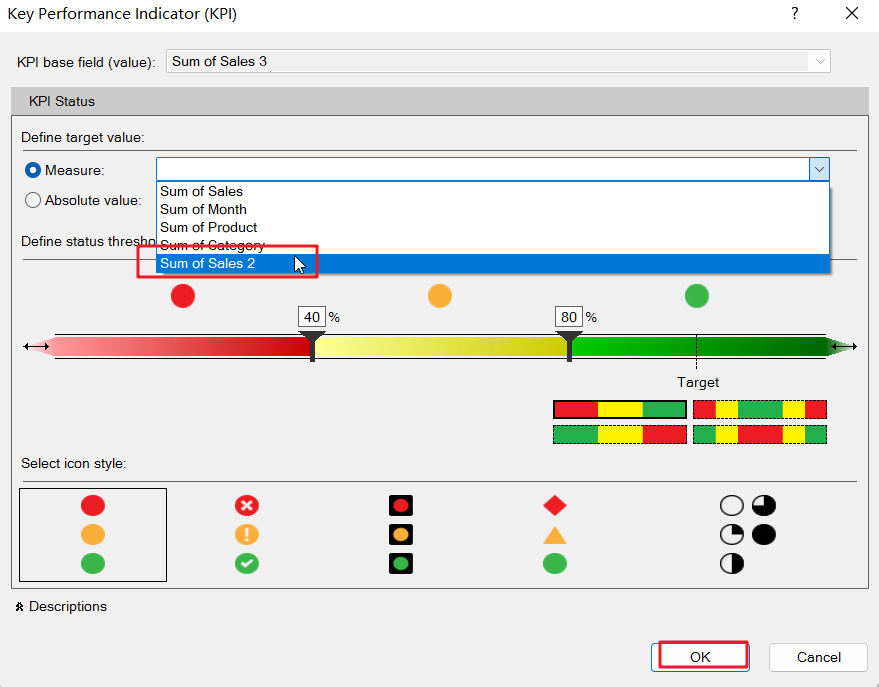
Now the KPI is created in your data model.