This post will provide you with step-by-step instructions on how to export one or more charts from Excel to PowerPoint using VBA code.
This VBA code provides a simple and efficient way to export one or more charts from an Excel worksheet to PowerPoint. Before running VBA code, you need make sure that the Microsoft PowerPoint is installed on your computer, and that the PowerPoint object library is selected in the Visual Basic Editor.
How to Enable PowerPoint Object Library?
To select the PowerPoint object library in Visual Basic Editor, just follow these steps:
Step1: Open the Visual Basic Editor by pressing “Alt + F11” on your keyboard.
Step2: Go to “Tools” > “References” in the menu bar. the References-VBAProject window will open.

Step3: Scroll down the list of available references in References-VBAProject window and look for “Microsoft PowerPoint <version> Object Library“, where “<version>” is the version of PowerPoint installed on your computer. Check the box next to the PowerPoint object library to select it. Click “OK” to save the changes and close the References dialog box.

After selecting the PowerPoint object library, you can use VBA code to interact with PowerPoint in your Excel workbook. For example, you can create a new instance of PowerPoint, open a presentation, add new slides, insert text and shapes, and so on.
Export Single or Multiple Charts from Excel Worksheet to PowerPoint with VBA Code
You can refer to the following steps to export single or multiple charts from your worksheet to a PowerPoint file with VBA code:
Step1: Open your Excel workbook and navigate to the worksheet that contains the chart(s) you want to export.

Step2: Open the Visual Basic Editor by pressing “Alt + F11” on your keyboard.
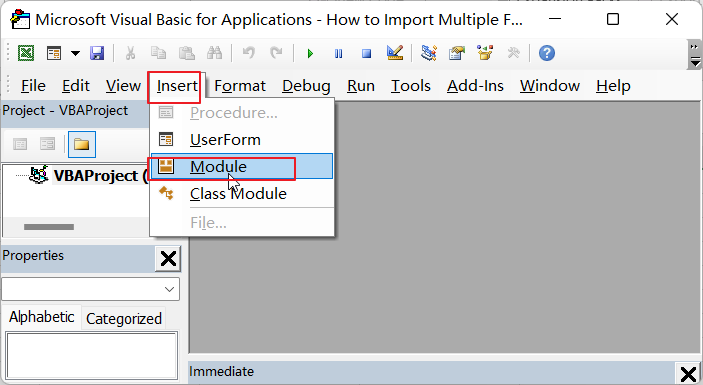
Step3: In the Visual Basic Editor, go to “Insert” > “Module” to create a new module.
Step4: In the new module, paste the following VBA code, Save the VBA module and return to the Excel worksheet.

Sub ExportChartsToPowerPoint_excelgeek()

    ' Declare variables
    Dim pptApp As PowerPoint.Application
    Dim pptPres As PowerPoint.Presentation
    Dim pptSlide As PowerPoint.Slide
    Dim pptShape As PowerPoint.Shape
    Dim chartObj As ChartObject
    Dim chartRange As Range
    Dim slideIndex As Integer

    ' Prompt user for PowerPoint file name and location
    pptFileName = Application.GetSaveAsFilename(FileFilter:="PowerPoint Presentation (*.pptx), *.pptx", Title:="Save as PowerPoint Presentation")

    ' Exit if user cancels or no file is selected
    If pptFileName = False Then Exit Sub

    ' Create new PowerPoint application and presentation
    Set pptApp = New PowerPoint.Application
    Set pptPres = pptApp.Presentations.Add

 ' Loop through each chart object in the active worksheet
For Each chartObj In ActiveSheet.ChartObjects

    ' Create a new slide in the PowerPoint presentation
    Set pptSlide = pptPres.Slides.Add(pptPres.Slides.Count + 1, ppLayoutTitleOnly)
    slideIndex = pptSlide.slideIndex

    ' Copy the chart to the clipboard and paste it as an image onto the slide
    chartObj.Chart.ChartArea.Copy
    pptSlide.Shapes.Paste
    Set pptShape = pptSlide.Shapes(1)

    ' Format the chart image as desired
    pptShape.Width = 400
    pptShape.Height = 300
    pptShape.Left = 100
    pptShape.Top = 100

    ' Add a title to the slide
    pptSlide.Shapes.Title.TextFrame.TextRange.Text = chartObj.Chart.ChartTitle.Text

Next chartObj

    ' Save and close the PowerPoint presentation
    pptPres.SaveAs pptFileName
    pptPres.Close

    ' Clean up
    Set pptApp = Nothing
    Set pptPres = Nothing
    Set pptSlide = Nothing
    Set pptShape = Nothing
    Set chartObj = Nothing
    Set chartRange = Nothing

    ' Show message box to confirm export
    MsgBox "Charts exported to " & pptFileName

End Sub
Step5: Run the VBA code by going to “Developer” > “Macros” and selecting the “ExportChartsToPowerPoint_excelgeek” macro.

Step6: This code will prompt the user for a file name and location to save the PowerPoint presentation.

Step6: The code will create a new instance of PowerPoint, open a new presentation, and loop through each chart on the active worksheet.

For each chart, the code will copy the chart and paste it as an Enhanced Metafile on a new slide in the PowerPoint presentation.
If the slide contains four or more charts, the code will add a new slide to the presentation before pasting the next chart.
Step7: When the code finishes running, a message box will appear indicating that the charts were exported successfully.

Conclusion
Exporting charts to PowerPoint can be a time-consuming process, especially when dealing with multiple charts. With the VBA code, you can automate this process and save yourself valuable time.