Exporting an Excel chart as an image can be useful when you want to share the chart with others who do not have access to the Excel file or when you want to use the chart in other applications, such as Microsoft Word or PowerPoint.
There are several ways to save or export an Excel chart as an image, including using the “Save as Picture” option in Excel and using VBA code. The “Save as Picture” option allows you to choose the format and size of the image, while VBA code can automate the process and provide more flexibility in customizing the image.
In this article, we will explore these methods in more detail and provide step-by-step instructions on how to save or export an Excel chart as an image.
Save or Export Excel Chart as Picture using Save As Picture Feature
You can use the “Save as Picture” option in Excel to save or export an Excel chart as an image. Here are the steps to follow:
Step1: select the chart that you want to save or export.
Step2: right-click on the chart and select “Save As Picture” from the drop-down menu list. The Save As Picture dialog box will open.

Step3: type one File name for saved picture, and select type as PNG, JPEG or others.

Step4: The selected chart will be saved or exported as an image file in the selected type. You can then use the image file in other applications.
If you are working in an older Excel version, and you can copy the chart firstly.

Then open Paint tool and paste the chart by clicking the Paste icon or just pressing Ctrl +V.

Last, you need to click the Save As button to save the current image file.
Save or Export Excel Chart as Picture with VBA Code
The below VBA code can also help you to save or export an Excel chart as a picture in your current worksheet. You just need to follow these steps:
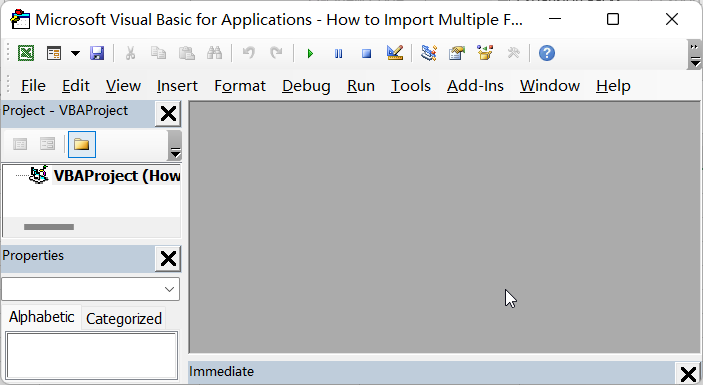
Step1: Open the Excel workbook that contains the chart you want to save as an image. Then press ALT + F11 to open the Microsoft Visual Basic Editor.
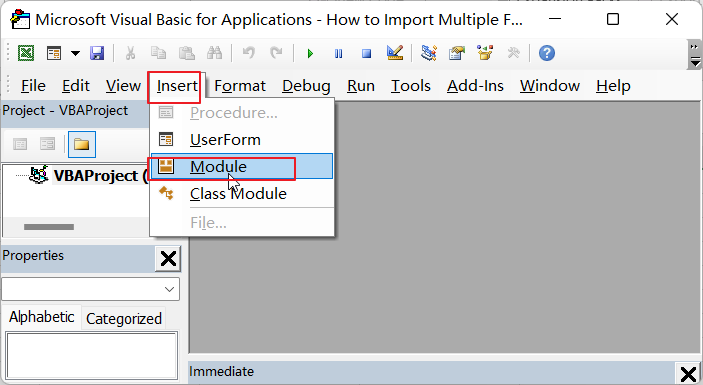
Step2: Insert a new module by clicking on “Insert” from the menu and then selecting “Module.”
Step3: Copy and paste the below VBA code into the new module (Module1).

Sub ExportSelectedChartAsPicture_excelhow()
    Dim chartObj As ChartObject
    Dim filePath As String

    'Prompt user to enter file name
    filePath = Application.GetSaveAsFilename(InitialFileName:="Chart", FileFilter:="PNG Files (*.png), *.png")

    'Check if a chart is selected
    On Error Resume Next
    Set chartObj = ActiveChart.Parent
    If chartObj Is Nothing Then
        MsgBox "Please select a chart to export.", vbExclamation, "No chart selected"
        Exit Sub
    End If

    'Export chart as PNG file
    chartObj.Chart.Export Filename:=filePath, FilterName:="PNG"
End Sub
Step4: Save the VBA code by pressing CTRL + S. and click Yes button.

Step5: Close the Visual Basic Editor and return to the Excel workbook.
Step6: Select the chart that you want to save as an image.

Step7: Press ALT + F8 to open the Macro dialog box or click on Macros command under Code group. Then select the macro named “ExportSelectedChartAsPicture_excelhow” from the list of macros and click on “Run.”

Step8: Enter a file name and select the desired file format in the “Save As” dialog box. Click on “Save” to save the chart as an image file.

Save All Charts in an Excel Workbook as Image
You can use VBA code to save all charts in an Excel workbook as images. Here’s an example code:

Sub ExportAllChartsAsPictures_excelhow()
    Dim sheet As Worksheet
    Dim chartObj As ChartObject
    Dim filePath As String

    'Prompt user to enter file name
    filePath = Application.GetSaveAsFilename(InitialFileName:="Charts", FileFilter:="PNG Files (*.png), *.png")

    'Loop through each worksheet
    For Each sheet In ActiveWorkbook.Worksheets
        'Loop through each chart object in the sheet
        For Each chartObj In sheet.ChartObjects
            'Export chart as PNG file
            chartObj.Chart.Export Filename:=filePath & "_" & chartObj.Name & ".png", FilterName:="PNG"
        Next chartObj
    Next sheet
End Sub
You can use this VBA code to follow the above steps to run it.

You need to modify the file format by changing the “Filename” parameter. The code will loop through each worksheet in the active workbook and then loops through each chart object in each worksheet.